
From The North Star To The Right Bid
Attribution Models and KPIs for optimisation keep getting more complex. What is the right bid? How do I set up the right budget for my campaigns? Where and when do I move budget? Ideally we want to spend money where our sales are coming from. But where our sales are coming from is dependent on the attribution model. With more and more attribution models becoming available, and customer journeys not getting any simpler, the seemingly simple questions we ask ourselves as marketers on a day to day basis are becoming less and less clear. And to be fair, these questions can be daunting at times. It feels like you are picking an entire ‘belief system’ when it comes to choosing an attribution model. Much like picking the right type of pasta for your sauce, it takes a lot of thinking, pondering, and holding internal philosophical discussions to identify which attribution model and KPIs are best to optimise your operation.
In this article we will highlight how to reverse engineer what the right bidding systems are for your campaigns based on the status of your operation and how this can determine which attribution model you should use for your bids and budgets.
#1: Pick the right North Star
The first element to take into consideration is Picking the right North Star. In ancient science, “North Star” is not only Kanye West’s daughter, but a term used to define the overall goal of a marketing operation. So “Picking the right North Star” really means defining the goal and our ambition, and the metric that we want to use to optimise our business. There are a few options.
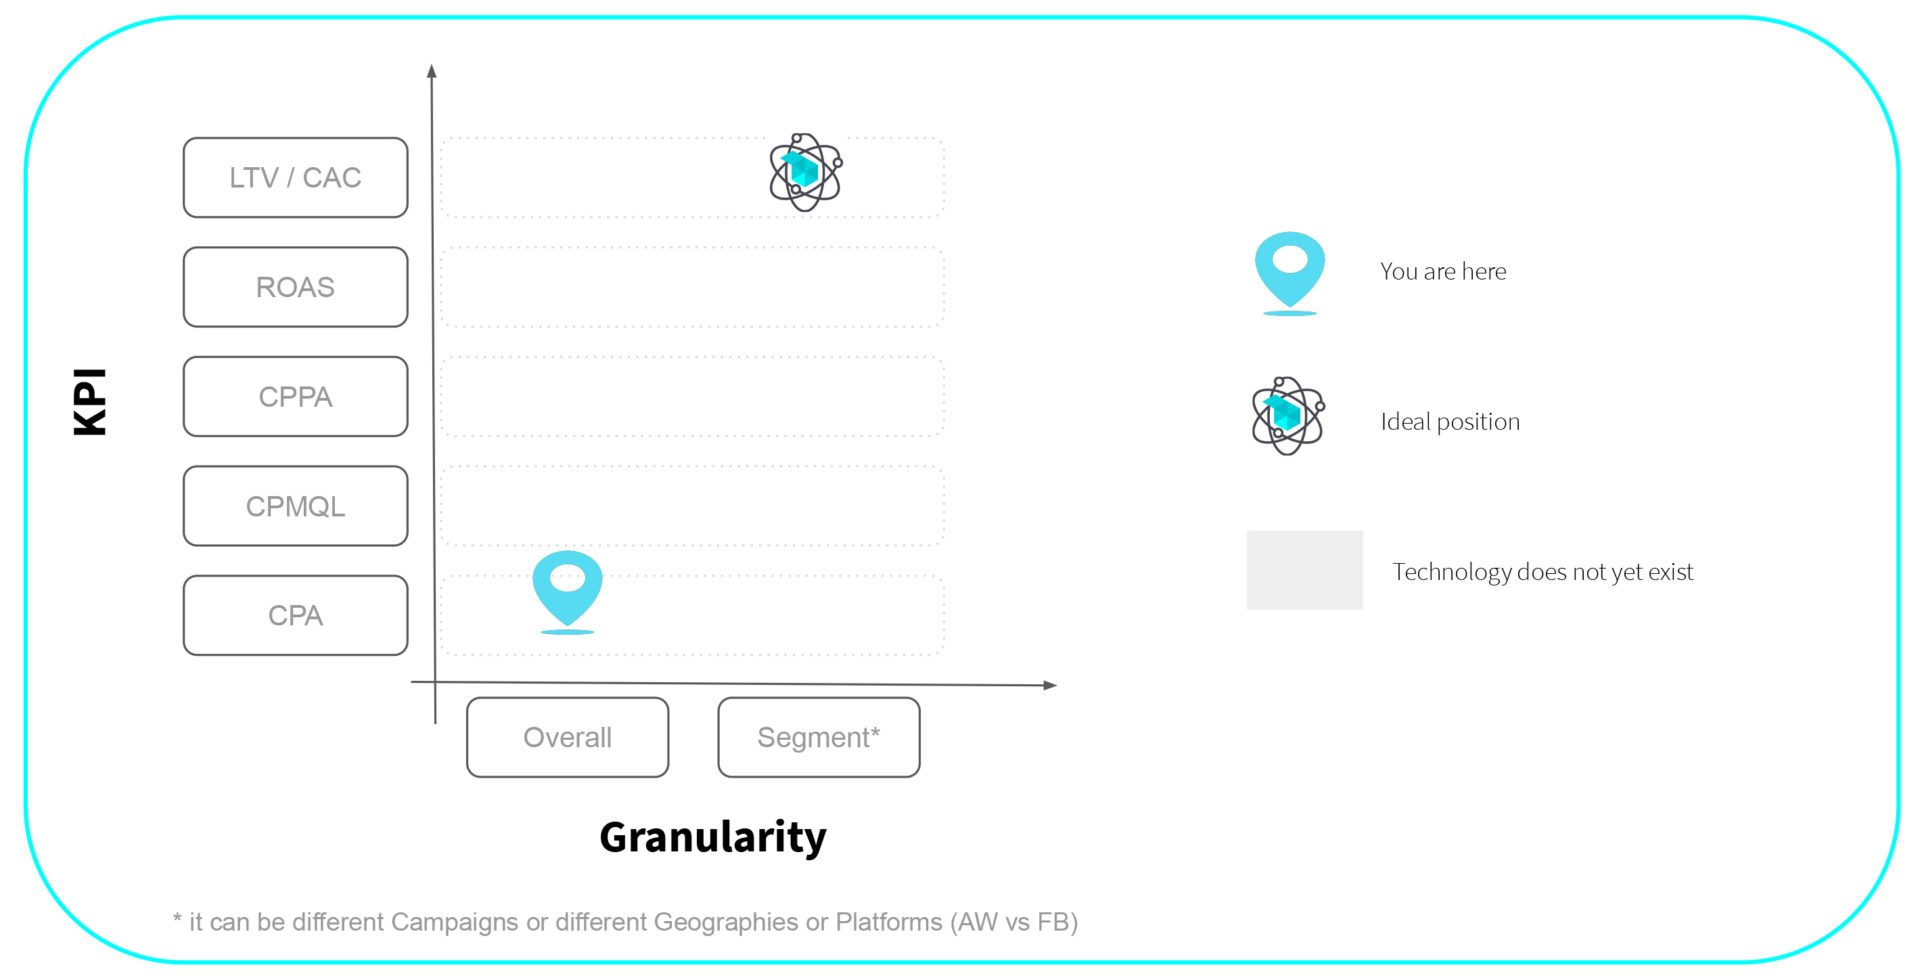
The most common “North Star” is Cost per Acquisition (CPA or CAC). It is easy to implement because it is simply the cost sustained in order to acquire a new customer. It is however, a very crude metric that ignores the quality of the acquisition. This is the metric that is mostly used by businesses that are focused on lead generation (imagine if you are generating leads for an insurance company or for a credit card application). Obviously, analysing your business in terms of the cost for each lead opens a big challenge on how to assess the quality for each lead. For instance, if we are measuring the cost for each credit card application, we don’t actually know how many of these applications will be successful or not.
Therefore, a more sophisticated step is the Cost per Marketing Qualified Lead (CPMQL). In this case, the KPI we are considering is the cost for a lead that has been deemed to be good enough. Leads from people who apply for a credit card will go through an acquisition process where the lead is acquired and then passed to the sales team who will assess whether the lead is good enough and then inject this information back into the CRM. It is a process of analysing if the lead is a real human being, a real contact, and whether they are on target with what the marketing team wants to define. Returning to the credit card example, offering a credit card to businesses located in the UK and that have a certain credit score might be the parameters to define if the lead is considered qualified or not. This is a decent level of granularity but relies on the lead quality assumption that qualified leads will convert into paying customers at a certain rate, which is obviously an assumption that is not necessarily true in 100% of cases.
An even more granular KPI can be the Cost Per Paying Customer (CPPA), sometimes referred to as CPAC – Cost Per Acquired Customer. In this case, this is a really good level because we are analyzing the actual value of a paying customer. Imagine a credit card or an insurance policy that has actually been issued, the problem with this approach is the fact that the number of paying customers will be significantly lower than the number of MQLeads or Leads and there may be a time delay between the lead arriving, the lead being qualified, and the lead becoming a customer, not to mention the challenges of getting all of this information into one place. This makes it difficult to identify and make the right decision when it comes to bidding correctly and allocating budget. We can start to appreciate that, as with pretty much everything in life, there are going to be tradeoffs. For example, if something is tasty, it either makes you fat or it’s illegal! Similarly, the deeper you want to go into a more sophisticated metric that allows you to capture the complexity of the user’s behaviour, the lower the volume of data you will have which makes it more difficult to make decisions that will help you optimise your campaigns. In other words, you can either find a very rough metric that will give you enough volume of information or you can find a more sophisticated metric that will give you a limited amount of data and will be more difficult to use for optimization. For a credit card company the CPMQL might be the right balance between volume (higher than CPPA) and quality (deeper than CPA).
Next is ROAS (Return On Advertising Spend). This provides a highly accurate level of optimization. Most e-commerce optimise by ROAS. However, there are a couple of problems: first of all, revenue can be scattered across multiple elements in a marketing operation (e.g. multiple keywords in a campaign); and secondly, we might also have outliers that could bias the judgement on a specific campaign. We might also find that cheaper items sell better online, making ROAS look better but potentially reducing our bottom line if these items have high postage costs and low margins that have not been taken into account. In non e-commerce businesses it is not trivial to implement ROAS as you need to take offline conversions into consideration. So despite ROAS being the most used KPI by e-commerce as it provides a high level of optimization, it is definitely not immune from detracting factors.
Now, this is a normal spectrum, but we can go a step forward and we can optimise by LTV (and particularly by LTV/CAC). In this case, what we are doing is optimising by taking a smarter version of ROAS into consideration. While ROAS only captures revenue on advertising spend, LTV can capture the likelihood that a certain customer will come back in the future and will buy again. Further, in LTV we are not simply looking at revenue but also considering the margins. We can see what margin we made on the first transaction. These considerations make the LTV a more accurate level of optimization. The cons are the same as we mentioned for ROAS but on top of this there is also another assumption; the likelihood of customers to come back – which is based on an average – so obviously it will not always be a perfectly clear picture and might take a long time to even get a rough outline.
 To summarize, when it comes to picking the North Star we could simplify and divide 2 types of goals for businesses:
E-commerce will want a return on investment and the best way to do that would be optimizing for LTV/CAC or ROAS;
Lead Generation businesses should opt for CPL or CPA, CPMQL or even more sophisticated – CPPA or CAC.
The perfect metric does not exist, it depends on several aspects such as your business goals, the nature of your business, and the sophistication of your digital operations. Therefore it also depends on whether you are just starting out or if you are more established. Once we pick the right North Star we can discuss attribution models.
#2: Attribution Models
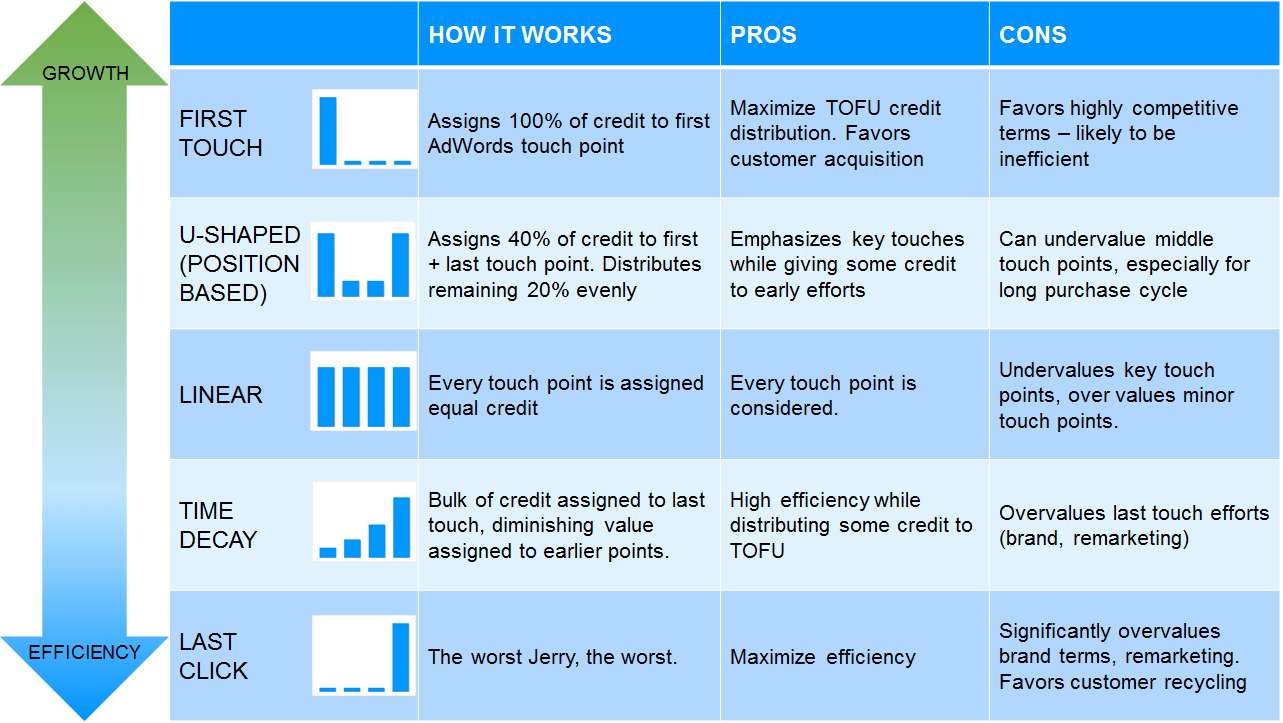
Attribution Models are an important topic in marketing today and the best analogy to define the importance of this conversation is to liken the experience to going out for drinks. Imagine you go out and start off with a couple of pints, then a glass of Prosecco, then another Prosecco, then a cocktail and then finally you have the brilliant idea to close the night off with a shot of Jagermeister. If you end up feeling a bit drunk… Which drink was it that actually made you drunk?
 If we are looking at the last click attribution model, then Jagermeister would be entirely responsible for your hangover….but this probably wouldn’t be a fair interpretation of reality. So the attribution model conversation is about how you attribute the value of a conversion to the right element in the user journey that pushes the user to buy a product, or sign up to a newsletter, or whatever the business goal is.
Multi-event attribution aims to distribute the credit of a specific conversion to all the advertising touchpoints that were influenced by that conversion. There are a few models and the position based model is within the so-called heuristic models (off-the-shelf models offered by Google). This is the lesser of several evils in most cases (assigning values across positions in the chain, regardless of actual impact on the completion of a sale). This attribution is heuristic as in a heuristic approach we are simply assigning the attribution based on the position in the chain using a top down approach. This is a very simplistic way of seeing the complexity of reality.
The step beyond this is the algorithmic attribution — complete analysis of the available data to determine the relative impact of a given touchpoint on conversions. Rather than “shortcutting” and applying a blanket statement with a position rule, the algorithmic attribution involves having a custom model and weightings for each touchpoint based on every single specific user dynamic. There are several algorithmic models. One of the models that we find quite accurate and reliable is the model based on Markov Chains.
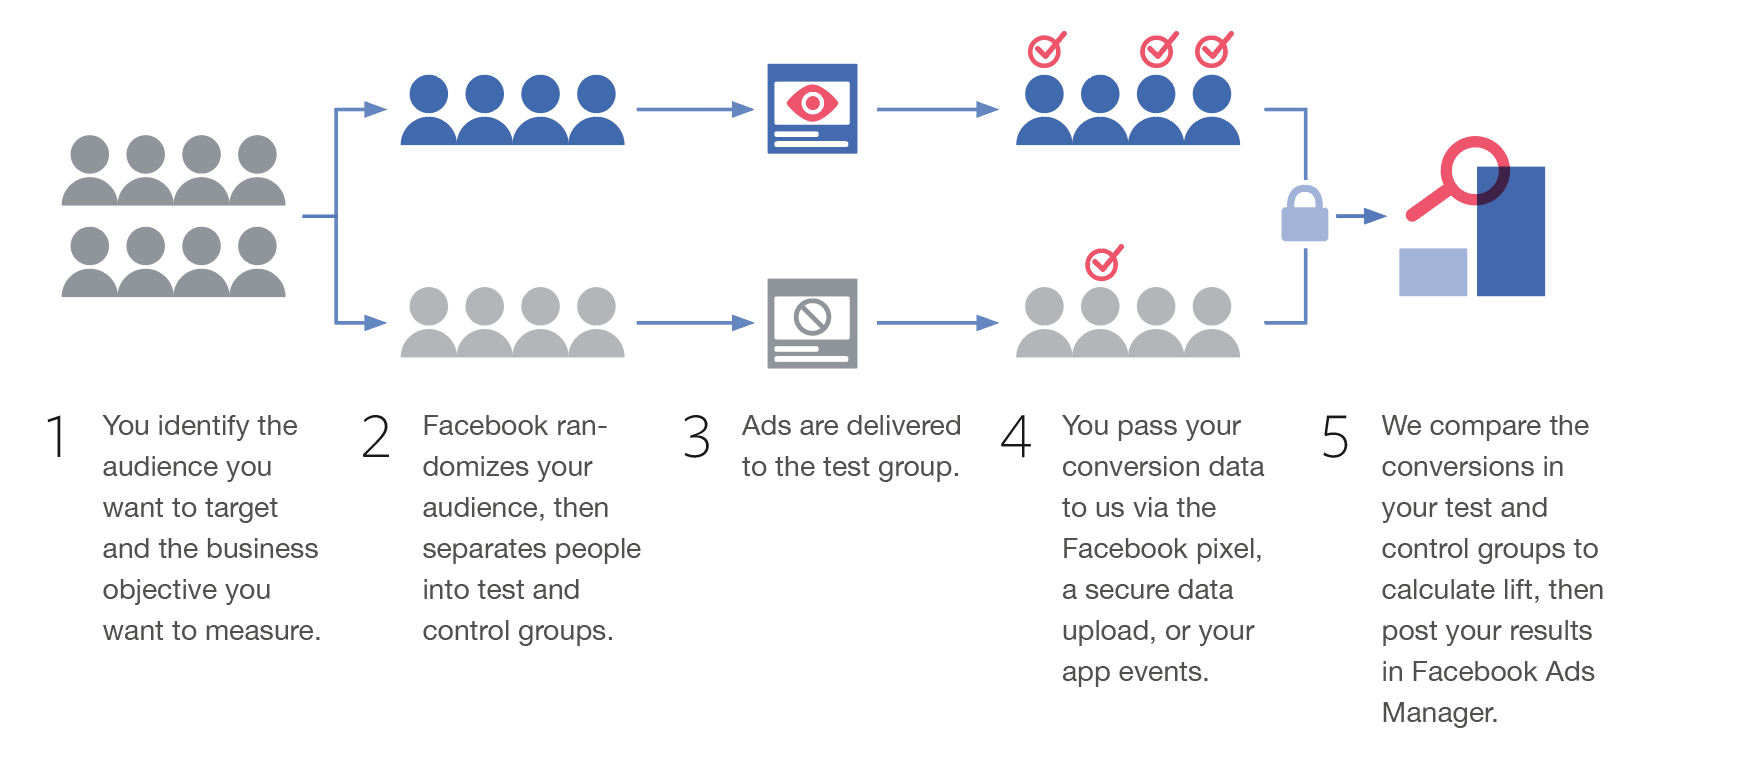
As well as the position of the touch point, we can also think about the type of touch point, especially if we are advertising outside of search. Do we consider ads that drive conversions from clicks equal to ads that drive the same value of conversions from impressions? Again this will depend on your business model and how and where you are reaching your customers. Typically, for search campaigns we can focus on click attribution, and when it comes to display, video, or social campaigns we would look at view attribution but take it with a pinch of salt. Again, we can start off the heuristic assumption that a click is more likely to influence the behaviour of a customer than a view, however we could test this assumption using an “uplift” test where one group of people sees our ads and another group does not.
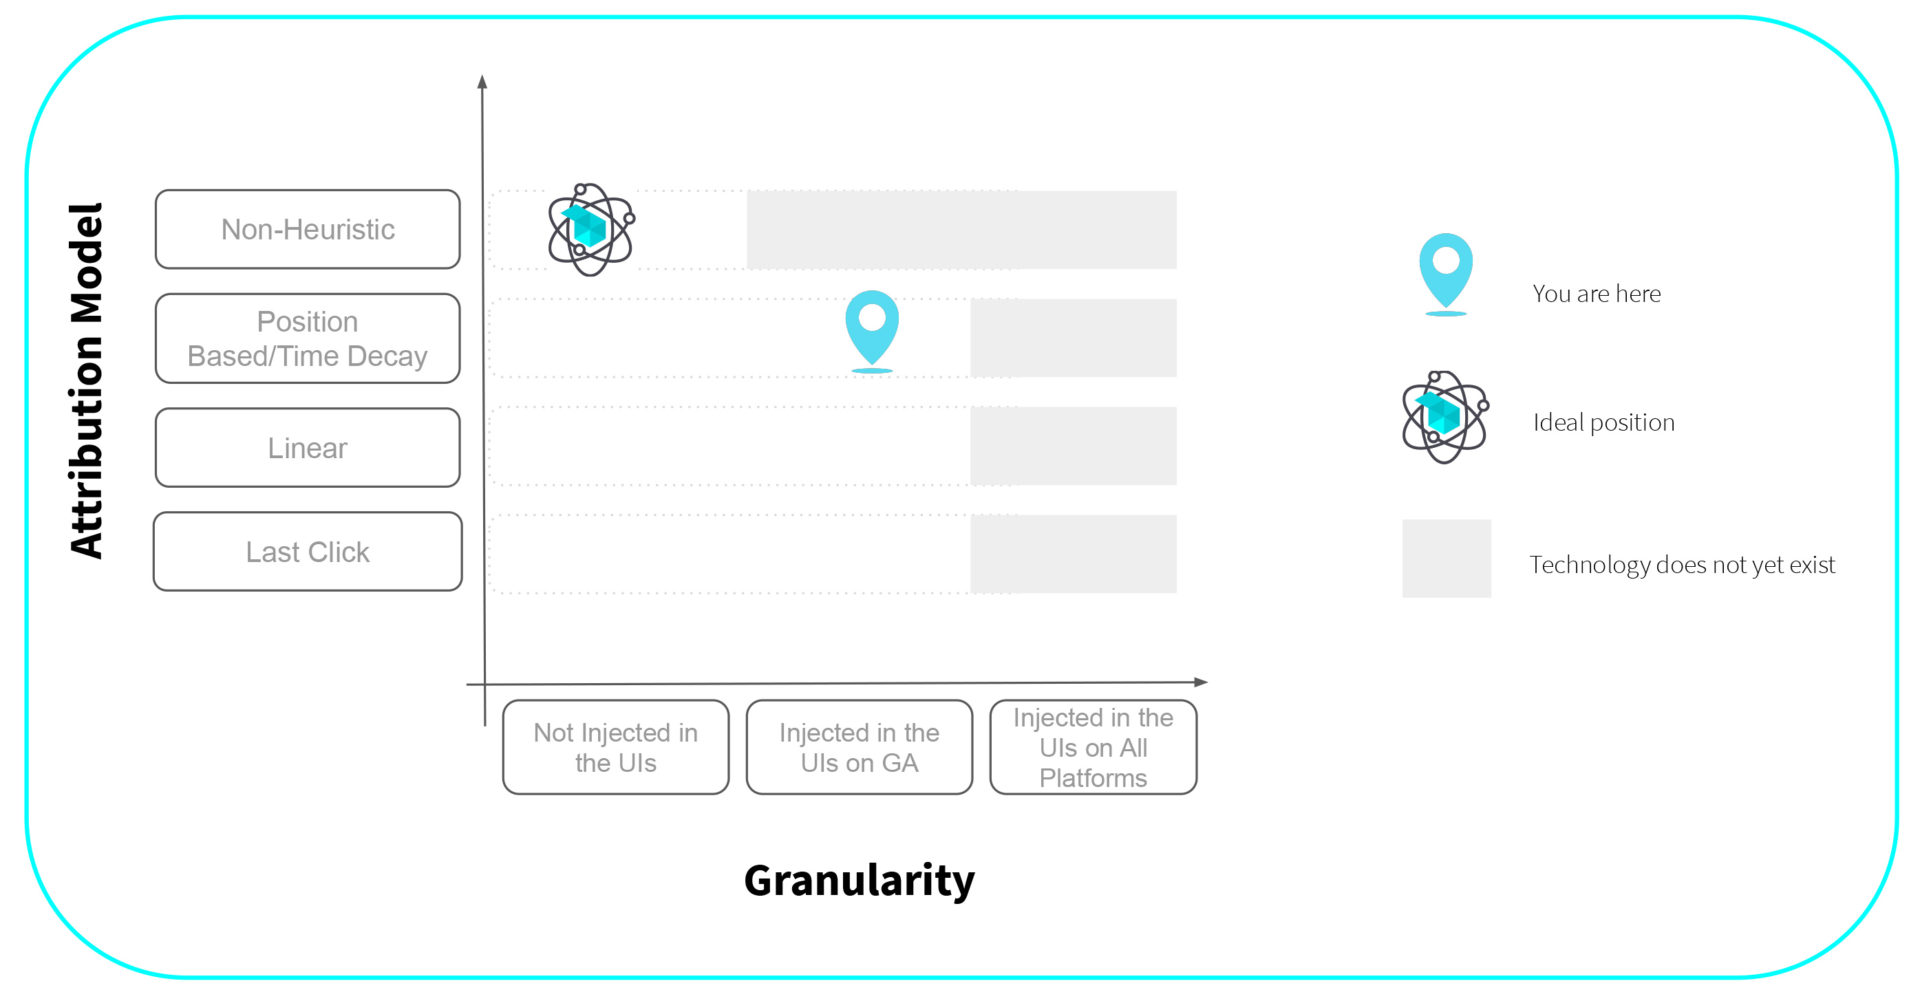 To pick the right attribution model, brands need to think about where they are in the level of sophistication of their business. Last click, despite being largely used, is one of the worst solutions that you can adopt, so at the very least everyone should try to consider the position based model and should go at least once per quarter into Google Analytics and check the model comparison tool and try to compare the last click vs position base vs linear attribution and first click. You will see some interesting differences. The position-based approach is preferred to last click, but still, it is a very simplified view of life, more sophisticated operations should embrace non-heuristic models moving towards algorithmic models, and Markov is definitely one of the best options out there. Like our friend wondering which drink has caused his hangover, the right attribution model will ensure that each drink is given the appropriate credit and thus help us decide whether we should start with Jagermeister shots and finish with beers the next time or whether it’s best to just skip the Prosecco.
#3: Pick the right Bidding Model
The first step was picking the right North Star (ie: what is the goal we want to optimize for); then we went ahead and analyzed the best attribution model (ie: what is the system we want to use to attribute that value across our marketing operations). Now we are ready to define the right bidding model.
When it comes to bidding models, the best analogy you can think of is how you drive a car. When it comes to driving a car there are three possible approaches: you can have a manual gear, an automated gear, or actually, you can have a self-driving car (autopilot).
This is a similar approach with bidding. The manual gear is a very resource-intensive way of driving, you are the one who needs to change the gear every single time and it is comfortable for everyone only if you’re a good driver. This is very similar to Manual bidding: you are bidding by hand, keyword by keyword; you are bidding manually on keyword view operations, or the placement, or the ad assets on Facebook.
The second approach is Automated Bidding. In this case, you can adjust a set of rules that would define the bidding for you. And you are still in charge of the bidding because you are defining the rules which your bidding system should apply to each keyword, but you are not relying on Google.
The third approach is going entirely on autopilot and using the Google Automated Solution. So there are three ways you could bid: Manual Non Google Bidding, Automated Non Google Bidding, Google Bidding – and even then, it really depends on the KPIs that you are using. There are obviously pros and cons for each one of these bidding models. No calorie-free chocolate can satisfy your tastebuds.
If you are doing the Manual non Google Bidding, this is really good because it can be customized to consider disruptive events on the business (e.g. change in seasonality, introducing special discounts, weather conditions etc.). Cons are obviously that this bidding model is not sustainable for a large account, it is suitable only for small operations (as it is very time intensive); moreover, it ignores Audience related information (i.e. Google knows more of what’s going on behind an auction, Google has access to signals that otherwise are not available: e.g. user location and operating system).
A better, or just a different, approach is using Automated Non Google Bidding. Here we are the ones deciding the bid by using a set of rules. These are additional to the Manual bidding model and also customizable in case of disruptive events. This model can also be used for larger accounts as it is implemented programmatically through APIs or Google scripts. However, we still lack the information on the audiences.
The next model is Google Smart Bidding. In that case, it does require a limited amount of data to be activated and it knows the auction from inside out, but usually it takes time to be trained, relies on historic series, and tends to ignore disruptive events. Imagine with the current situation with COVID-19, this model obviously has problems for this type of bidding solution. Very often, it is a full-on black box and is very difficult to read what it will bring in terms of positive or negative results.
When it comes to the bidding model, it is crucial to understand the size of your operations. If you are a large operation, there is no way you can bid manually. At the very least, you should use automated non Google Bidding and if it is important to be in the driver’s seat and it is not possible to sustain a black-box type of approach, then Google Bidding should be something to steer away from.

In a nutshell:
If we aren’t sure we are calculating the right bid for a keyword or spending the right amount on an ad, we don’t need to guess. We can follow this process to make sure that our small, day to day (often very granular) decisions are linked to our high level, long term business goals (i.e. making money).
First, make sure we set the right KPI. ROAS, CPA or whatever, we need to make sure our marketing North Star is navigating us towards what we actually care about.
Next, we need to find a usable attribution model. It won’t be perfect, but it won’t be worse than last click. This tells us which ads are helping us get to our business goals.
Finally, we can make sure that our bidding is helping us hit our KPIs based on the best possible attribution model.
Remember to review this over time. As you get more data, you learn more about your customers and can better predict their value and you can begin to slowly start moving further down the funnel and building a more sophisticated growth engine. But perhaps most importantly, and never forget this, cheese never, ever, ever, goes with fish.