
Here’s 3 ways to measure the incremental impact of Facebook Ads in your Digital Marketing
When it comes to measuring impact from Facebook ads, making sense of data in a complex cross channel and cross device environment is not an easy task. Advertisers and Media Agencies have all struggled to define the incremental impact of Facebook ads, but we’ve been able to, with a high degree of confidence, assess the impact of Facebook ads on the business.
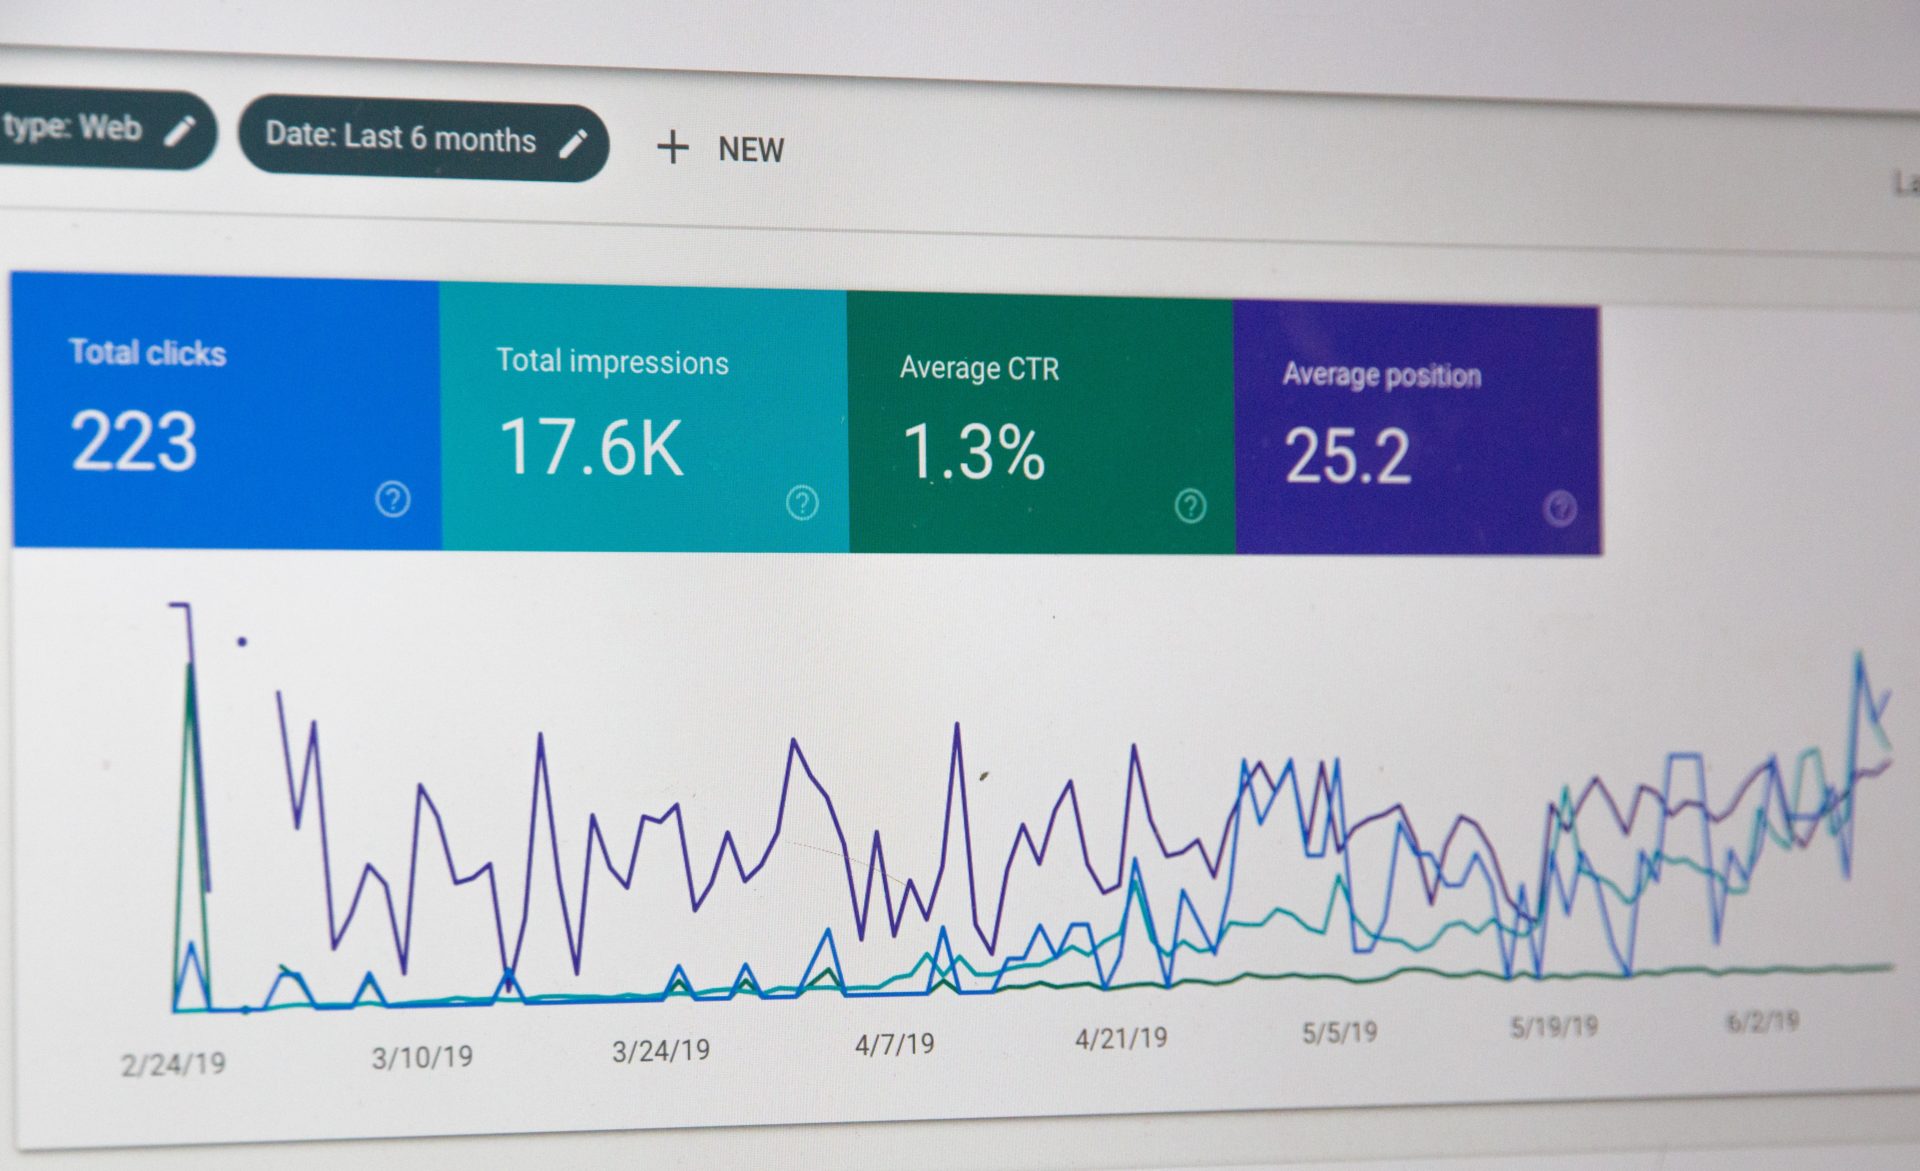
Have you ever been faced with this classic conundrum? Facebook says you’ve made 50k in Revenue from Facebook Ads, and Google Analytics says Facebook Ads have made 10k in Revenue. Which one should we trust?
The reality is that we should consider both data points and bear in mind the differences.
Google analytics is a powerful tool but has limitations when it comes to accurately assessing FB’s true value, meaning that FB’s true value is often underestimated… Why?
GA is cookie based! – This means that users are not automatically recognised when using different devices or browsers, so if a user deletes his cookies, GA won’t know that this is the same user!
Limited cross-device capabilities – This only works for users that are simultaneously logged into their Google account in their current browser and have the ads personalisation feature turned on (Google signals feature) or via login into the tracked website (User-ID feature)
No visibility on ad impressions – Meaning that it is not possible to see post-view attributions.
On the other hand, FB tends to be too optimistic sometimes. Some of the differences with Google Analytics are:
Facebook pixel doesn’t consider other channels – so it takes credit for every conversion where a Facebook ad was involved during the selected attribution window.
Post view conversions are considered – Facebook takes ad impressions into account for post-view attribution (users that see an ad on Facebook and then convert from other traffic sources, even without clicking on the ad);
Facebook has more cross-device measurement capability – Facebook’s measurement system is based on people as opposed to cookies, and the FB login is much more common than the Google login!
You cannot compare apples to oranges! Well, you can. But if you do… Don’t expect to see the same thing 🙂
By default, Facebook shows all conversions which take place within 28 days after clicking and 1 day view after initial ad impression. GA would show all conversions taking place within 90 days of clicking (by default) according to your chosen attribution window.
So how can we measure the incremental impact of Facebook ads effectively?
Here are 3 data driven ways you can estimate FB incrementality:
- Geo Treatment test
- Facebook Lift Analysis
- Markov cross channel analysis
1. Geo Treatment test
In medicine, the typical approach to test a new drug is by a Randomized Controlled Trial (RCT) where the new drug is given to some randomly selected patients (the treated) and a placebo to other patients (the control group).
If, after some time, we see there is a difference in the two groups and nothing else occurred to these patients, we can infer the causal effect of the new drug on a specific outcome.
This type of approach can be used to test the impact of Facebook as well. In our analogy with the new drug scenario, our patients are geographical locations (they can be cities, DMAs, regions, countries ecc.) and the new drug is the introduction of Facebook advertising.
This means that in some locations we will show the Facebook ads and in the remaining ones we will not.
At this point, we can use a simple OLS regression to estimate the impact of introducing Facebook in our media mix:
![]()
Here y_i is the outcome of interest (ideally our conversions), D is a dummy variable that takes value one if the location was treated and 0 otherwise and X refers to some variables you want to control for.
If the randomization was properly carried out, the delta coefficient should capture the so-called ATE (Average Treatment Effect) which represents the average effect of the introduction of Facebook Ads.
This is the “light” version of the theory, Google has some in depth documentation on this, and an even more complex approach here if you want to try it out!
A few things to watch out for if you want to implement this approach:
- There is a city mismatch from FB data to GA data, pick your cities/towns wisely and make sure they are defined in the same way on both platforms!
- Not necessarily applicable for operations with only a few geographic units available for testing.
- Ensure there aren’t any specific functions that would affect the significance of the test like city specific promotions, physical events or offline promos.
- Seasonality interference. Try to run the test over a period of relatively flat seasonality so that your results are not skewed.
- The Facebook Algorithm performs best with bigger audiences so be careful not to over segment the cities and hinder the performance of campaigns.
- In the pre-launch phase, you need to double check that your randomization was balanced in terms of characteristics that could affect your experiment. For example, if, by any chance, the cities you decided to use as “treated” were the wealthiest ones, you could inadvertently drive incorrect conclusions because of this.
2. Facebook Lift Analysis
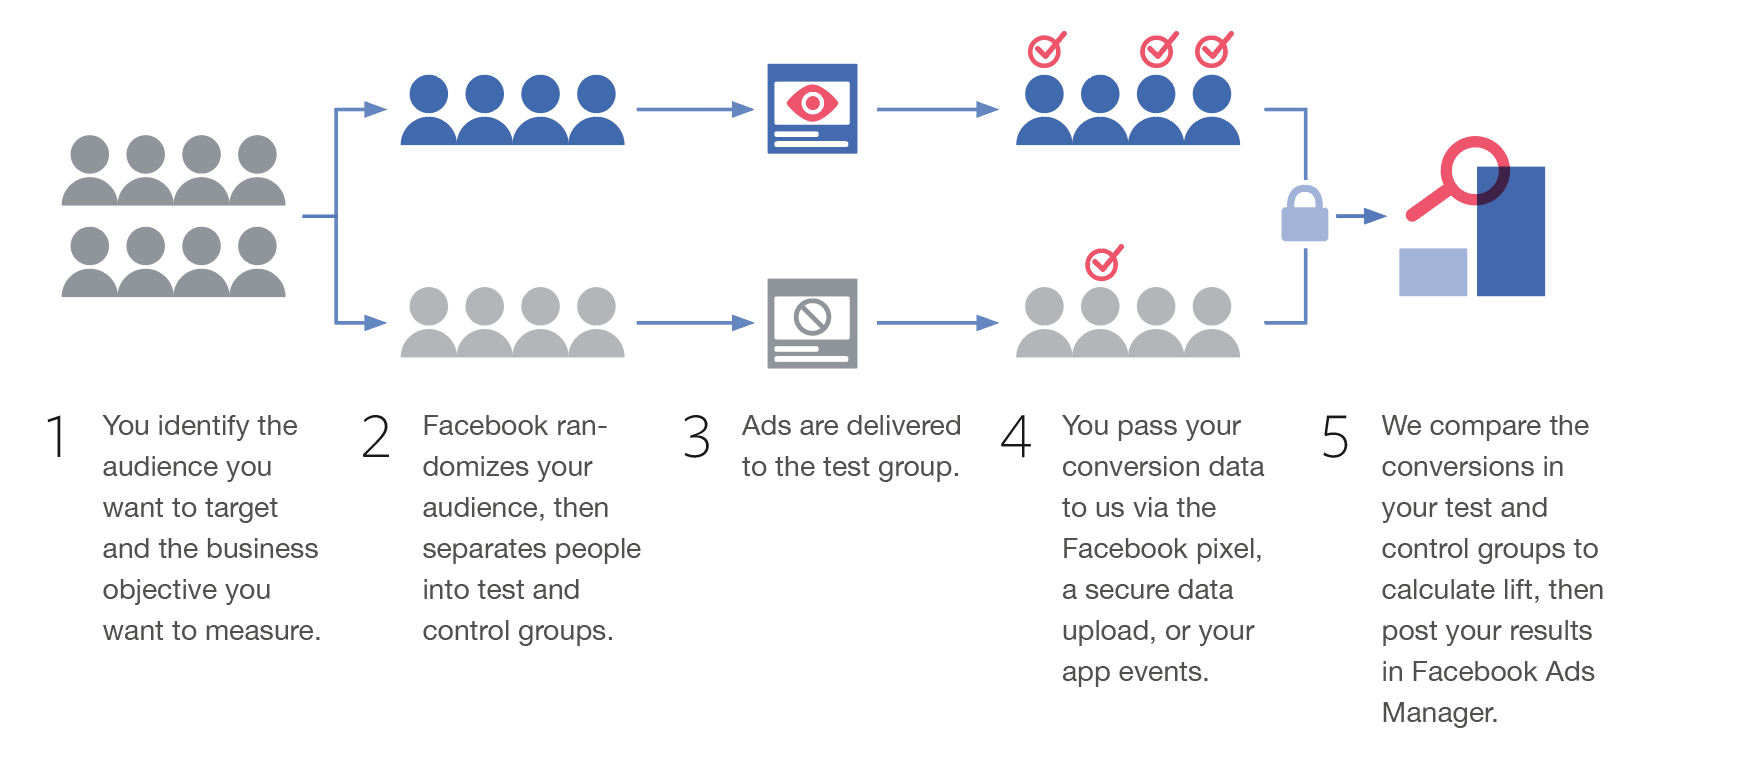
Similar to the Geo test outlined above the Facebook Conversion Lift analysis is a similar test. But instead of grouping Geos manually lift tests use randomised groups, with some people in a control group, and some people in a test group. People in the test group are exposed to ads while people in the control group do not receive ads. The estimated uplift is then measured by making a comparison to the test group and control group after collecting significant data.
image from here
A few things to watch out for if you want to implement this approach:
- You can’t be certain that there are no external factors affecting the results as you don’t have full control over the randomised groups while the experiment is running.
- Testing can sometimes result in smaller-sized test audiences with comparatively higher CPM’s.
3. Markov Cross channel
Another approach would be to use a slightly different set of math rules, i.e. using Markov attribution to see the impact of Facebook in cross channel operations.
There is a nice presentation by Gianluca here that explains how the Markov model works. The main idea is to use Markov chains to see what happens to your conversion rate if you remove certain parts of your conversion paths.

In this case we can perform this analysis at channel level in order to assess the impact of Facebook across all of our media mix.
Here you can find a sample of a script to implement the Markov attribution model, the only ingredients are a CSV file containing conversion paths (you can use the one from Google Analytics in the Multi-Channel-Funnel level) and the R software to launch the script.
A few things to watch out for if you want to implement this approach:
Google Analytics conversion paths only account for people who clicked on your ads directly and don’t consider post view!
To conclude: There is no right or wrong way to measure the impact of Facebook Ads on your digital marketing and this is definitely not an exact science, however considering these 3 different aspects will help you better gauge the incremental value that Facebook brings to the whole operation!